
Wave data from Q3 2025 shows a market holding steady after a strong first half of the year. Job volumes rose slightly while applications fell, easing competition for some roles but keeping demand consistent across key sectors. Job boards continued to dominate performance, Education once again led job posting activity, and Manufacturing remained the top industry for candidate interest. Despite lower overall application numbers, the market remains active, with several industries still attracting high engagement per job.
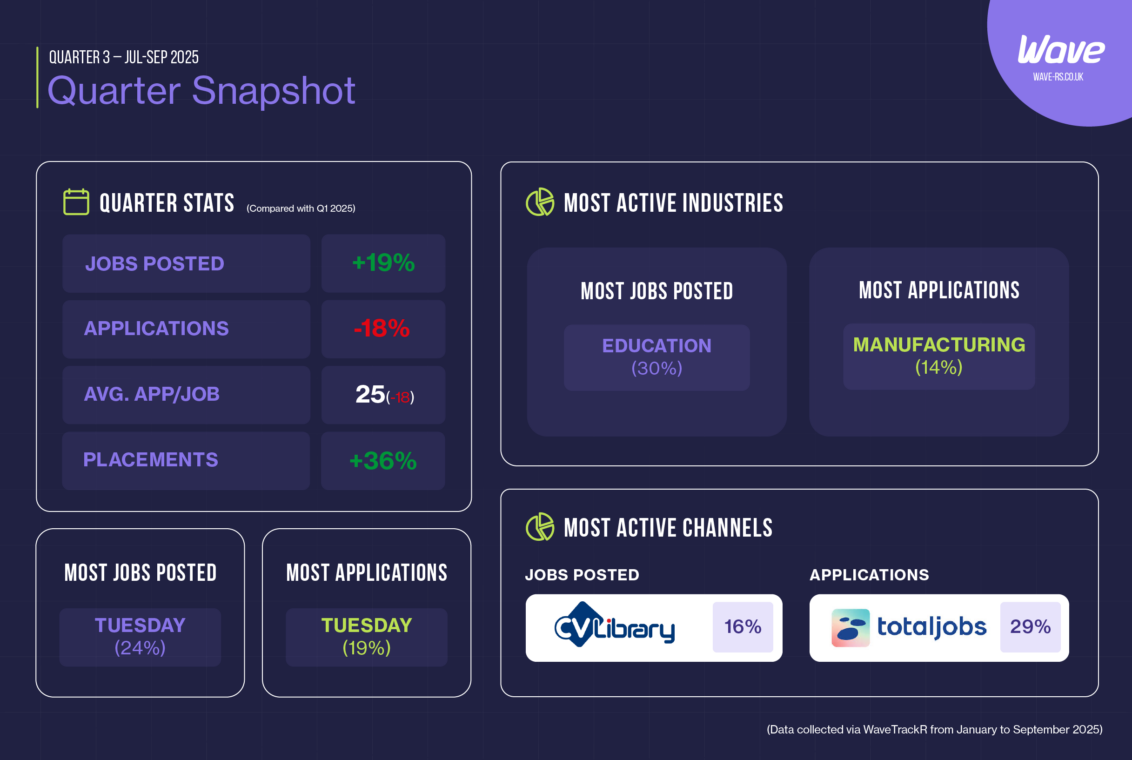
Quarter Snapshot
- Jobs posted: +19%
- Applications: -18%
- Avg. applications per job: 25 (down by 18)
- Placements: +36%
- Most active day for jobs & applications: Tuesday
- Most jobs posted: Education (30%)
- Most applications: Manufacturing (14%)
- Most active job board: CV-Library (16%)
- Most applications via: Totaljobs (29%)
Jobs & applications by month
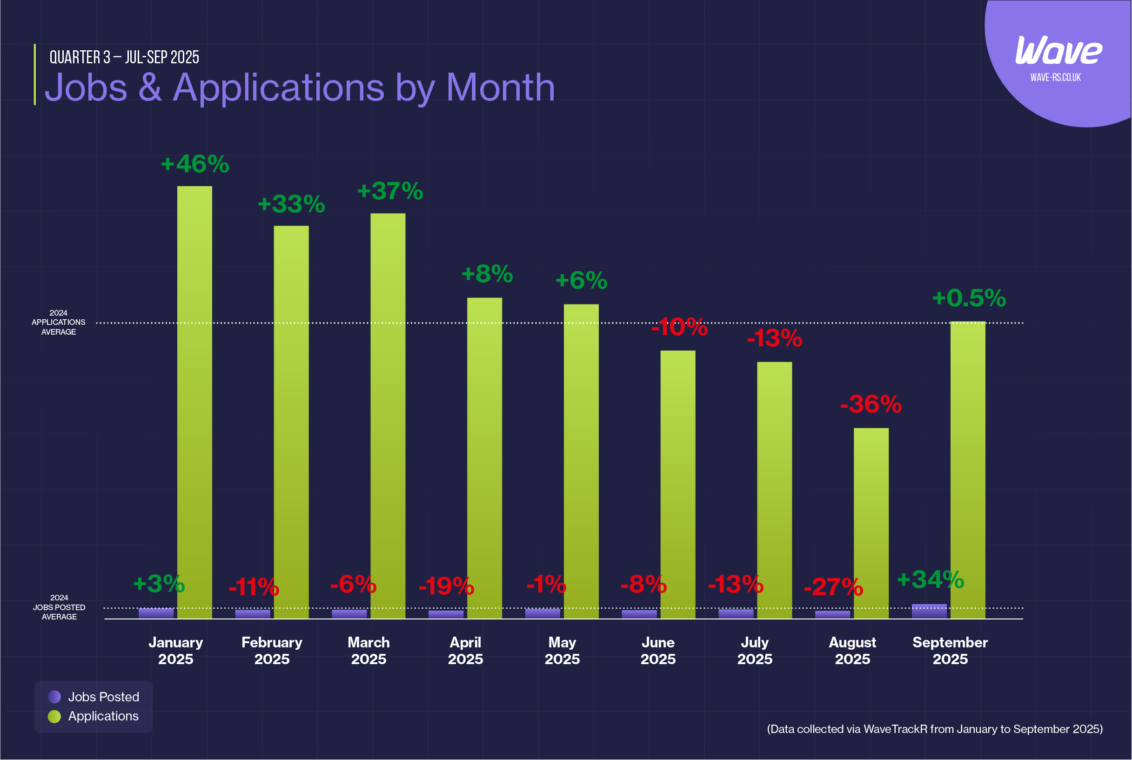
Candidate activity fluctuated through Q3, with the summer slowdown clearly reflected in the data. Jobs fell in July (-13%) and August (-27%) before rebounding strongly in September (+34%). Applications followed a similar pattern, down in July (-13%) and August (-36%) before stabilising in September (+0.5%).
Although volumes dipped mid-quarter, both jobs and applications stayed close to 2024 averages, showing a stable underlying market. The September rebound indicates renewed confidence from both recruiters and candidates as activity picked up after the summer lull.
Jobs & applications by quarter
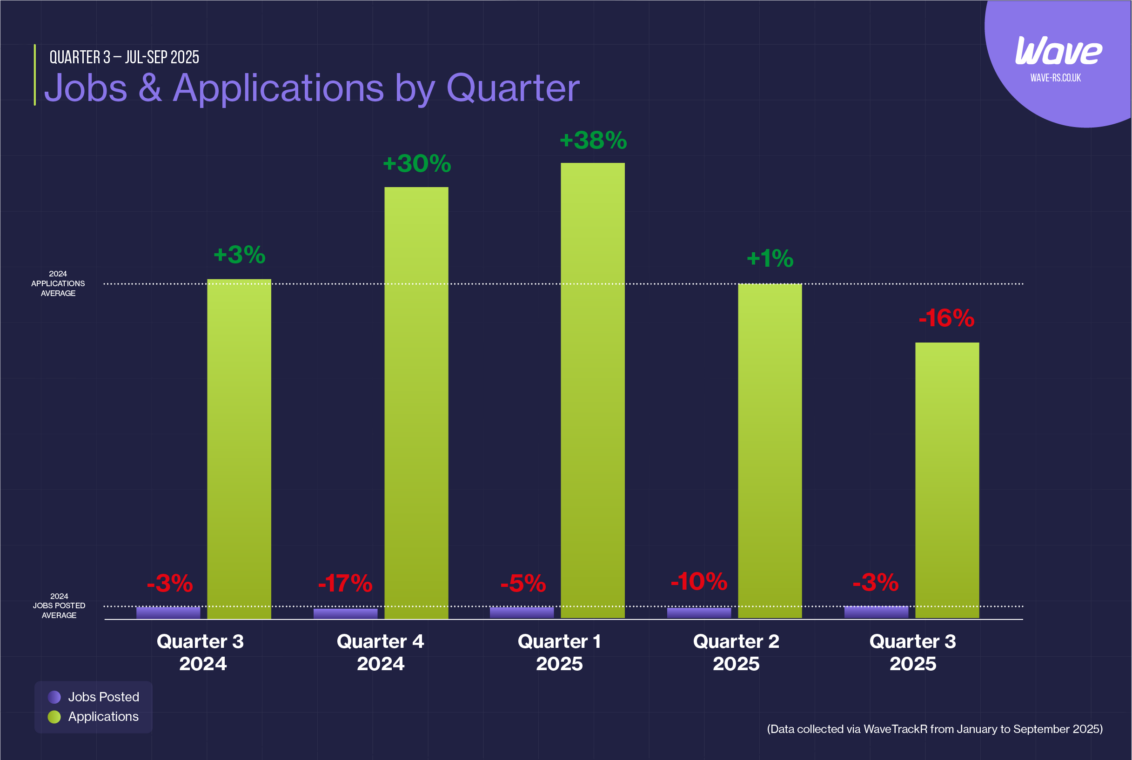
The quarterly data shows a stabilising market following a strong start to the year. Applications dropped by 16% in Q3 while job postings fell slightly by 3%, signalling a more measured pace of recruitment. After sustained growth through Q1 and Q2, the slowdown points to a natural rebalancing between supply and demand rather than a loss of momentum.
This steadier activity suggests the market has reached a new equilibrium, with recruiters maintaining consistent demand but facing fewer applications per role. The result is a more competitive environment for talent, where the focus shifts from volume to quality and speed of response.
Jobs & applications by industry
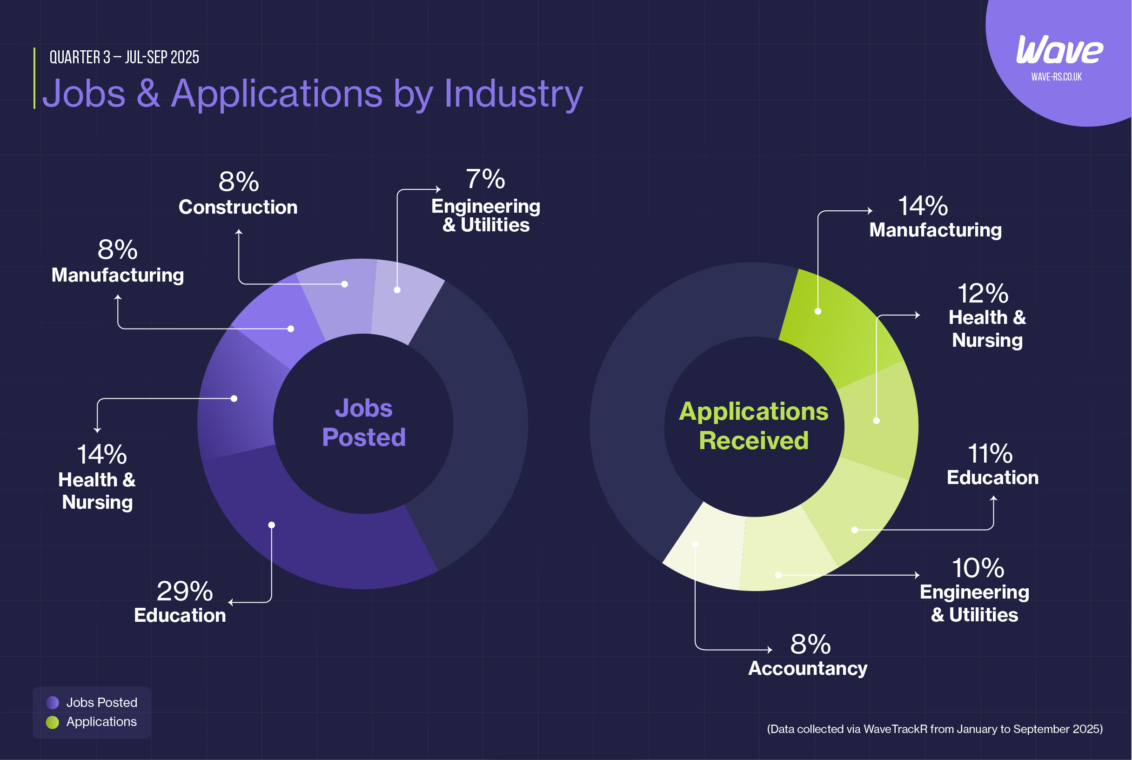
Education continued to lead job creation in Q3, accounting for 29% of all roles posted, followed by Health & Nursing (14%), Manufacturing (8%), Construction (8%), and Engineering & Utilities (7%). Manufacturing, meanwhile, remained the most attractive sector for candidates, generating 14% of all applications, ahead of Health & Nursing (12%), Education (11%), Engineering & Utilities (10%), and Accountancy (8%).
This ongoing imbalance between job availability and candidate interest highlights familiar pressure points. Education roles remain difficult to fill despite sustained demand, while Manufacturing continues to attract high competition from jobseekers.
Average applications per job by industry
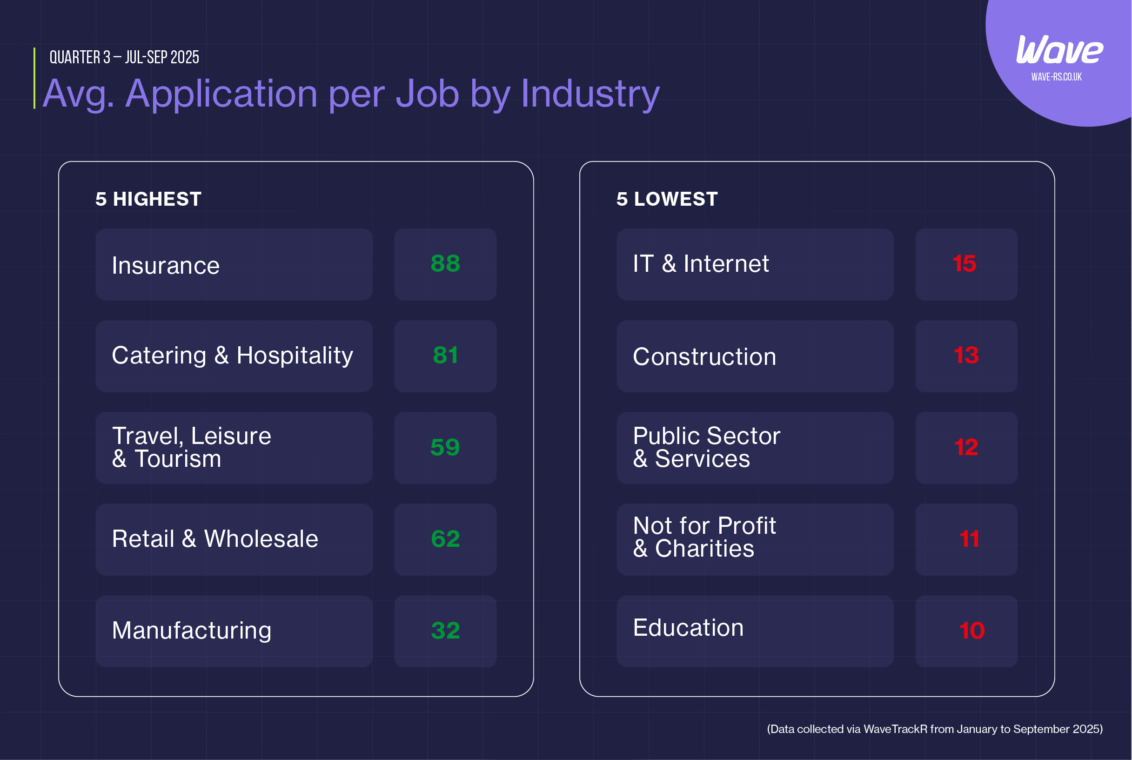
The average number of applications per job fell to 25 in Q3, but variation across industries remained wide. Insurance topped the list with 88 applications per job, followed by Catering & Hospitality (81), Retail & Wholesale (62), Travel, Leisure & Tourism (59), and Manufacturing (32).
At the opposite end, Education continued to see the lowest engagement, with just 10 applications per job. Other low-response sectors included Not for Profit & Charities (11), Public Sector & Services (12), Construction (13), and IT & Internet (15). These figures underline the uneven spread of candidate activity across the market, with some sectors facing high competition and others still struggling to attract applicants despite ongoing demand.
Jobs & applications by channel
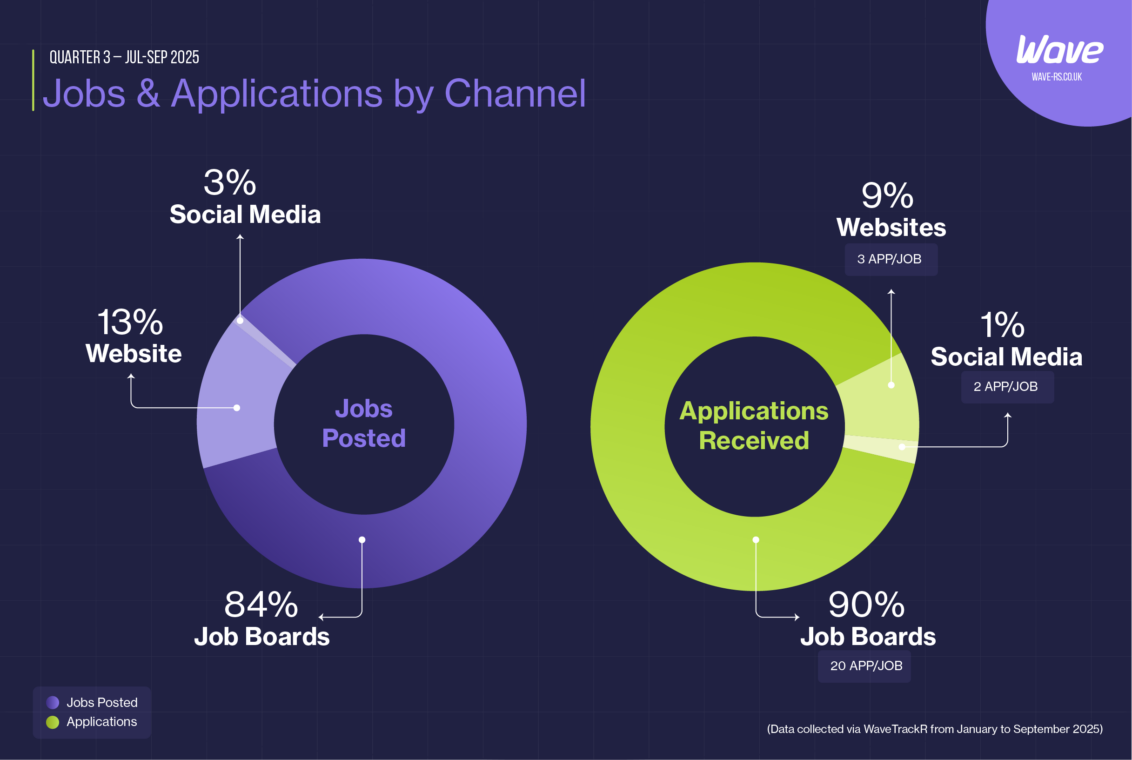
Job boards remained the primary channel for recruitment in Q3, accounting for 84% of all job postings and generating 90% of all applications. Websites contributed 13% of jobs and 9% of applications, while social media made up the remaining 3% of postings and 1% of applications. On average, job boards delivered around 20 applications per job, compared with three from websites and two from social media.
CV-Library led the quarter for job posting share at 16%, while Totaljobs received the highest share of applications at 29%. These figures reaffirm job boards as the cornerstone of most recruitment strategies, continuing to outperform other channels in both scale and results.
Q3 2025 marked a period of stability for the recruitment market. Job activity remained consistent while applications eased, reflecting a more balanced landscape after the high volumes seen earlier in the year. Job boards continued to dominate, Education maintained its position as the leading source of vacancies, and Manufacturing attracted the most candidate interest. As the market steadies, the focus for recruiters shifts from managing volume to improving quality — ensuring that every application counts.
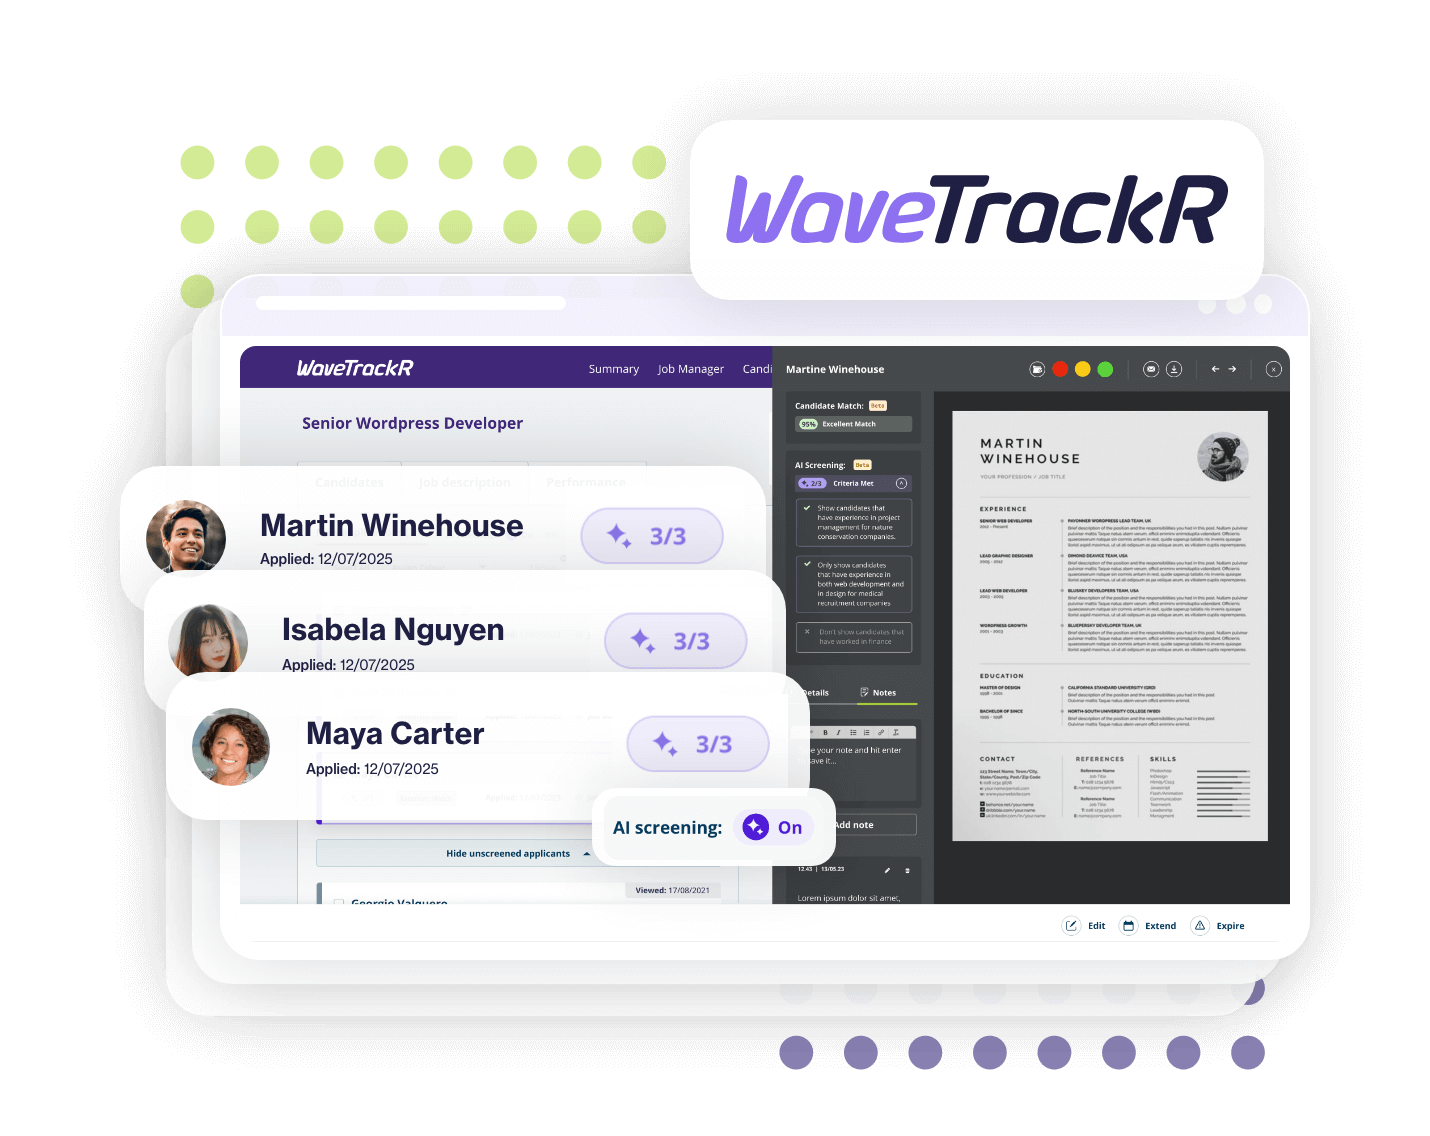
WaveTrackR helps you attract, screen and hire faster.
From job posting to shortlisting — get more done in one place.


