Q4 2025 marked a period of stabilisation in recruitment activity following a softer third quarter. Job posting volumes increased quarter-on-quarter, applications recovered at a faster rate, and average applications per job rose, suggesting renewed engagement from candidates towards the end of the year.
While overall application volumes remained below the peaks seen earlier in 2025, Q4 showed clearer signs of balance returning to the market as employers increased hiring activity and candidate response levels improved.
This report is based on recruitment data collected via WaveTrackR across the UK recruitment market.
Quarter Snapshot
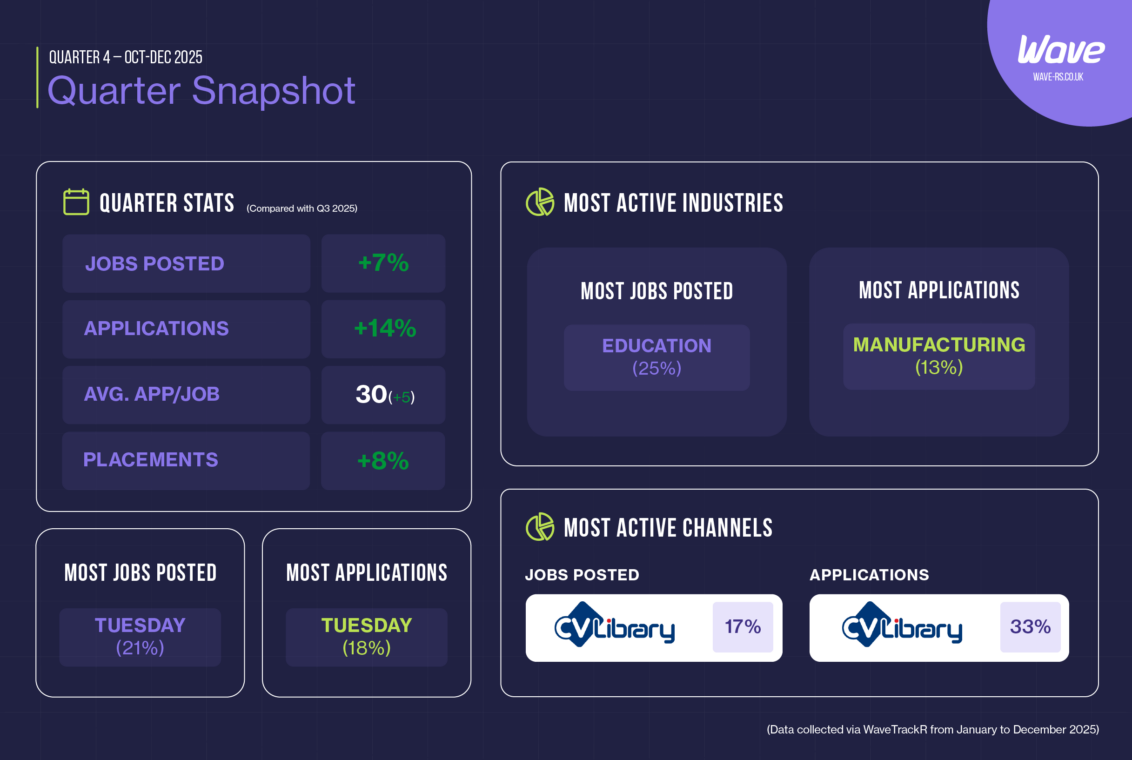
Compared with Q3 2025, Q4 recorded growth across all core metrics. Jobs posted increased by 7%, while applications rose by 14%. Average applications per job reached 30, up by five quarter-on-quarter, and placements increased by 8%.
This marks the strongest overall quarterly performance since the start of the year and reflects renewed hiring confidence going into 2026.
- Jobs posted: +7%
- Applications: +14%
- Avg. applications per job: 30 (up by 5)
- Placements: +8%
- Most active day for jobs & applications: Tuesday
- Most jobs posted: Education (25%)
- Most applications: Manufacturing (13%)
- Most active job board: CV-Library (17%)
- Most applications via: CV-Library (33%)
✉️ Get this data via email by subscribing to the Wave Newsletter
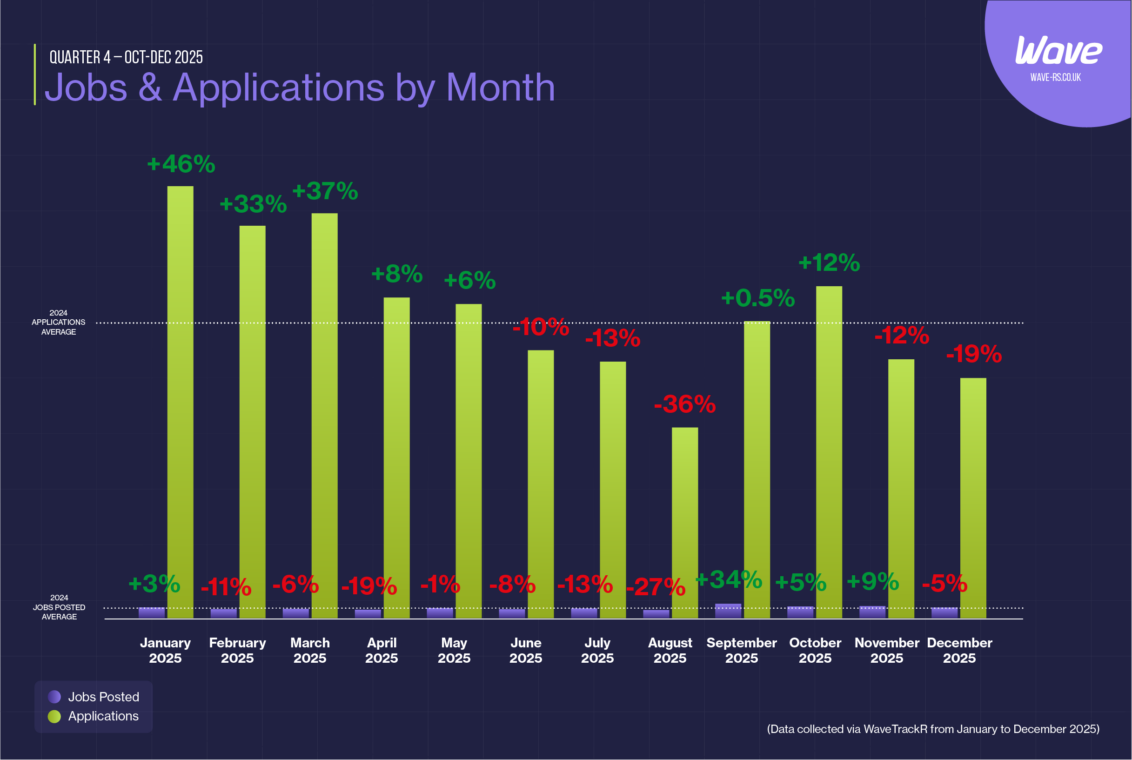
Jobs & Applications by Month
Application volumes fluctuated throughout 2025. The year began with strong growth in January, February and March, followed by a gradual slowdown through late spring and summer, reaching a low point in August.
A partial recovery was recorded in September and October before application volumes declined again towards the end of the year. Job posting activity followed a similar trend, with the most notable increase occurring in September.
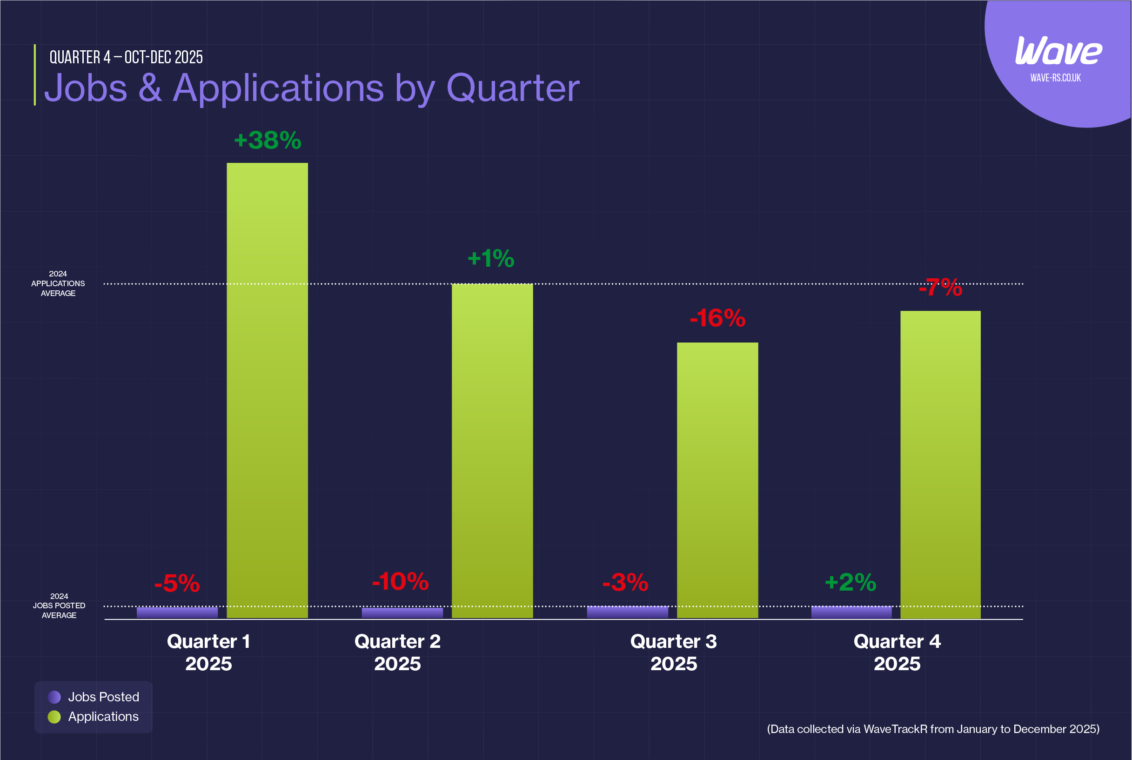
Jobs & Applications by Quarter
Across 2025, Q1 recorded the strongest growth in applications while job postings declined. Q2 saw applications stabilise but posting volumes fall further. Q3 represented the weakest quarter for applications, alongside continued softness in job activity.
Q4 was the first quarter since Q1 to record growth in jobs posted, while applications improved compared with Q3, signalling a more stable end to the year.
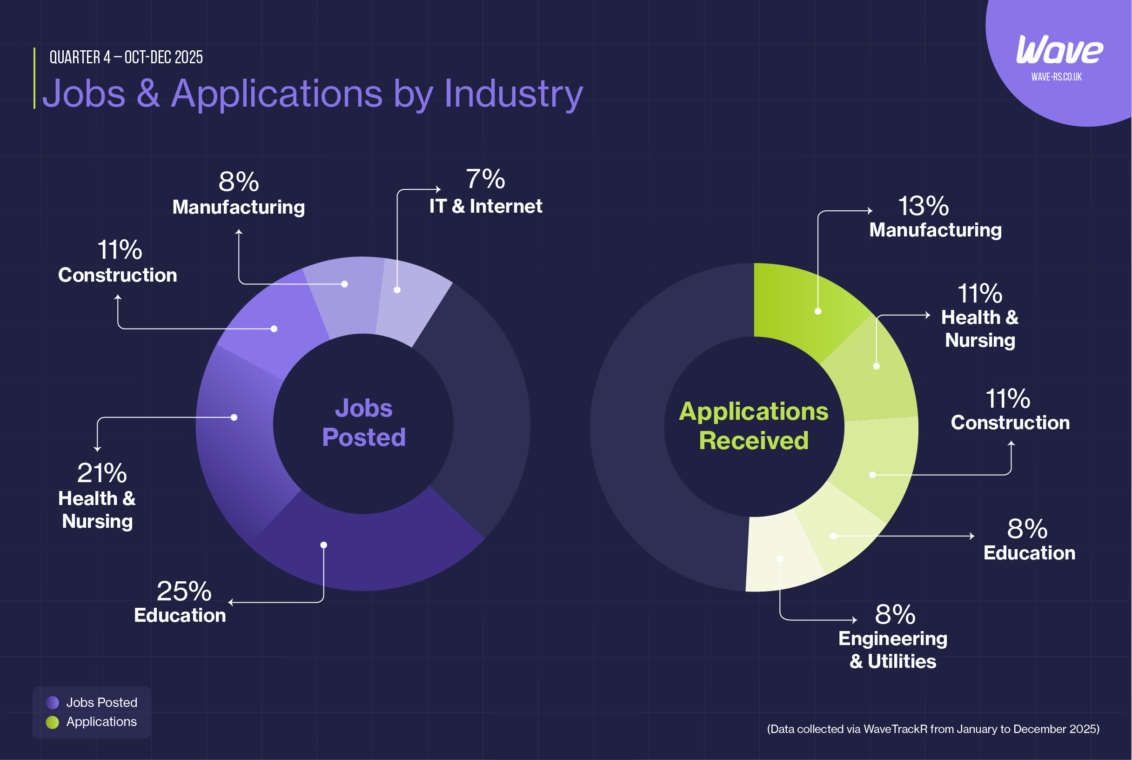
Jobs & Applications by Industry
Education remained the most active hiring sector in Q4, accounting for 25% of all jobs posted. Health & Nursing and Construction also represented significant shares of job volume, reflecting ongoing demand across essential and infrastructure-related sectors.
Manufacturing generated the highest share of applications during the quarter, despite accounting for a smaller proportion of jobs posted. Health & Nursing and Construction followed closely, while Education received a lower share of applications relative to its posting volume.
This divergence highlights continued variation in candidate availability and demand across industries.
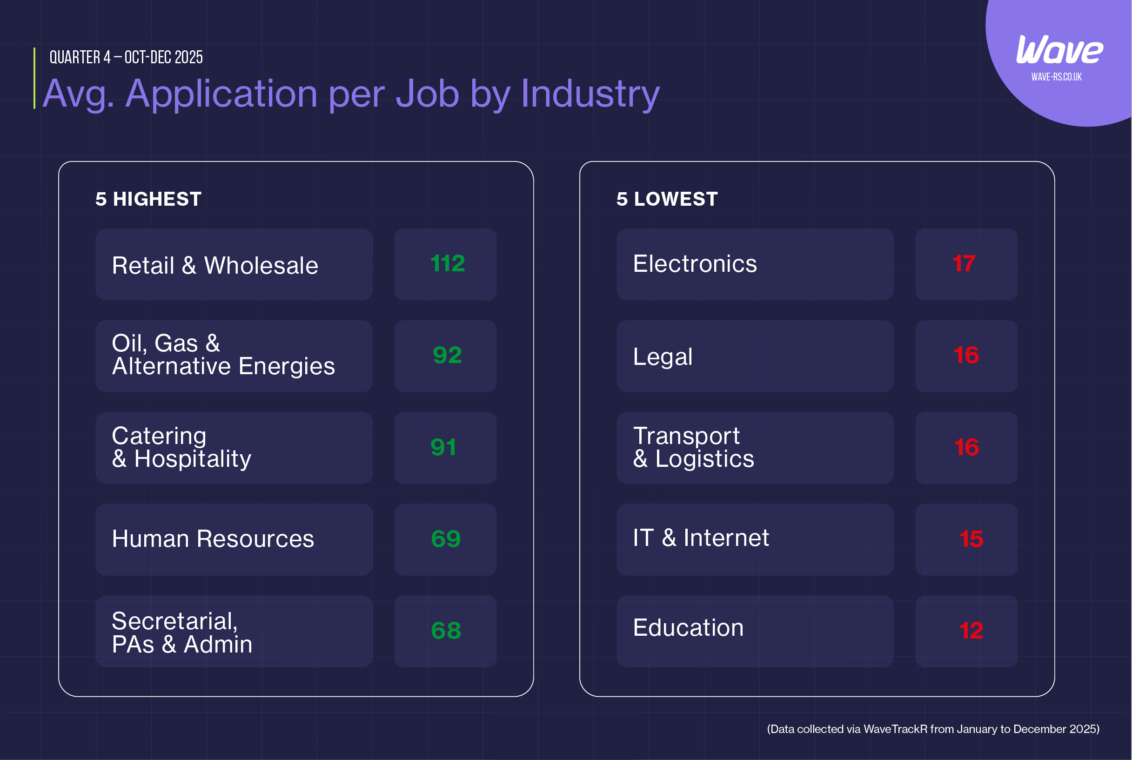
Average Applications per Job by Industry
Average applications per job varied widely across sectors in Q4. Retail & Wholesale recorded the highest average, with roles attracting over 100 applications per job. Oil, Gas & Alternative Energies and Catering & Hospitality also saw strong candidate competition.
At the lower end, Electronics, Legal, Transport & Logistics, IT & Internet, and Education recorded the lowest average applications per job. In Education, high job volumes combined with lower application rates suggest ongoing candidate shortages.
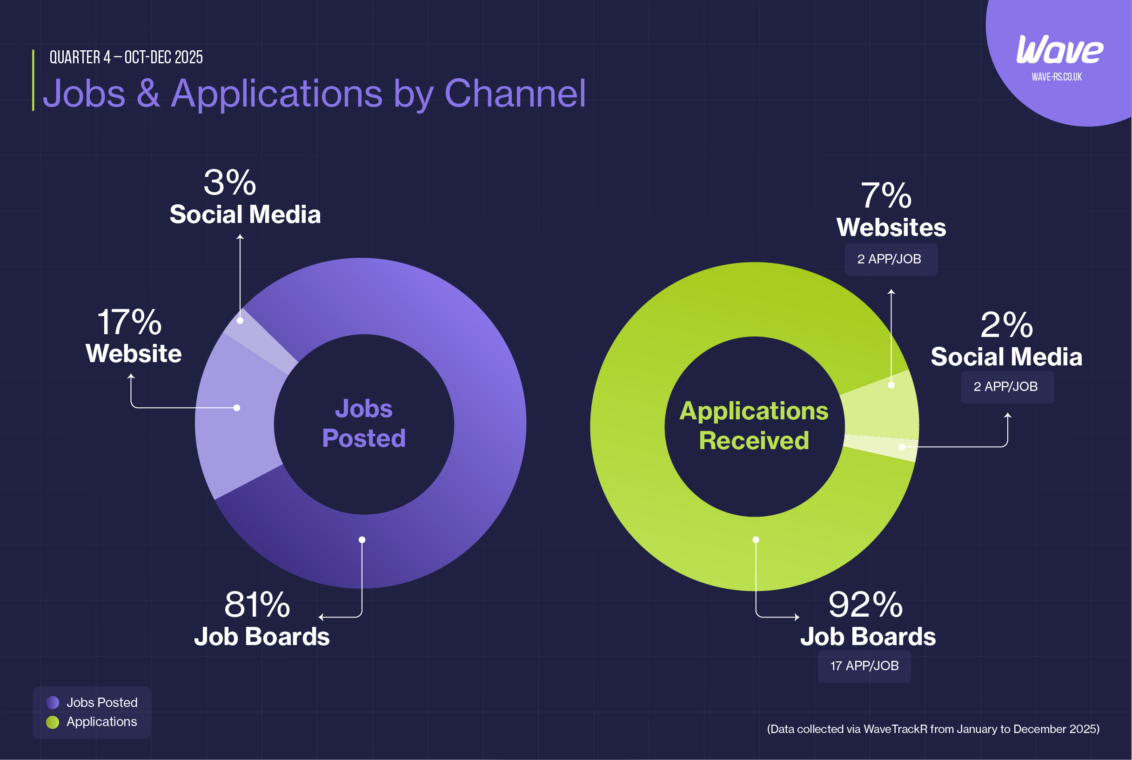
Jobs & Applications by Channel
Job boards continued to be the dominant channel for both job distribution and candidate response during Q4. They accounted for the majority of jobs posted and generated over 90% of all applications received, delivering an average of 17 applications per job.
Recruitment websites represented a higher proportion of job postings than applications, averaging two applications per job. Social media contributed a small share of both jobs and applications and also averaged two applications per job.
The gap between posting activity and application delivery reinforces the continued reliance on job boards to generate candidate volume.
Q4 2025 closed the year on a more balanced footing. Job posting volumes recovered, application engagement improved, and average applications per job increased. While challenges remain in certain sectors, the data points to a steadier recruitment market heading into 2026.


